
July Patch: Oracle EPM Reports Agent

‘Ask Oracle’ allows users to ask Oracle to analyse and explain the contents of an EPM Report via a chat panel.
What is the EPM Reports Agent?

In the latest patch Oracle has released a new feature: EPM Reports Agent – ‘Ask Oracle’. This allows users to have a conversation with the agent about contents of the report – for example:
“Which cost centres are showing the highest variance to budget?”
“Which columns are formula columns are in the grid?”
This is available in Cloud EPM Platform test environments when viewing a report in HTML view. The chat window will appear automatically if Generative AI is enabled for the application. It can be toggled open and closed via this icon:

In Narrative Reporting, an additional feature is available which allows users to Ask Oracle to search the library for reports – for example:
“Show me the reports which present Balance Sheet data”
First Impressions
My first impressions are that this will be useful for the following scenarios:
Fast analysis of report values e.g. top 5 performers, highlighting significant variances, especially in larger reports – and without having to pre-emptively configure the report to present these analysis results.
Newer users trying to reconcile which dimension members are being displayed in a report. Dimension members are often hidden from a report’s final presentation, but the agent can tell users the exact intersection of data and the unformatted values.
Less queries to the report designer / administrators because users can query Oracle understand the formulas or definitions of the reports themselves. In Narrative Reporting, users can use Ask Oracle to find them reports with the contents they’re searching for.
During my testing, I asked Oracle the following questions:
What is the highest variance to budget? (Some references blurred out)

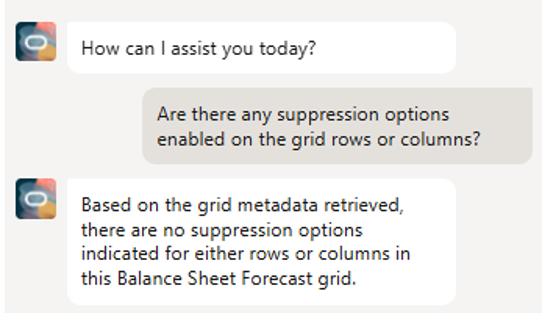
Are there any suppression options enabled on the grid rows or columns?
Could you tell me all the dimension members and POV selections that make the Total Revenue – Jan value of 167,917?

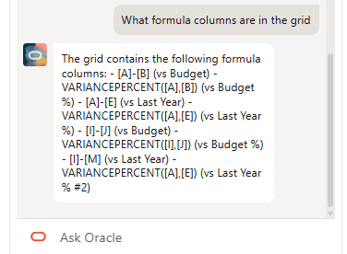
What formula columns are in the grid?
Is the number being scaled?

What does the Agent have access to?
It doesn’t seem to have access to everything in the definition of the report – I asked which substitution variables are used in the definition of the report and it wasn’t able to say. However, it does know whether any conditional formatting is being used – scaling and suppression too.
I asked the EPM Reports Agent to tell me what it has access to in the report to understand the scope of responses it can provide. Here was the response:
"From a report grid you can view the design-time definition and the runtime data that the grid exposes.
This includes:
The grid shape: number of rows and columns and the visible row- and column-axis members (e.g., metrics, periods, scenarios, etc.).
The list of metrics/fields that appear as columns, together with any calculated columns and the formulas that define them (e.g., variance %, share of total, custom expressions).
The hierarchy metadata for dimensions that support drill-down (parent/child relationships, totals, subtotals).
Derived or total rows that are generated by the report (e.g., grand totals, subtotals, formula rows).
The underlying calculation intent for each derived value (operation type, operands, scope, ranking limits).
Contextual metadata such as the report name, POV selections (period, scenario, currency, site status), and the execution ID.
The raw cell values for any visible row-column intersection, including formatted and unformatted numbers. These elements are available through the grid-analysis tools, allowing you to query values, perform look-ups, rank or compare rows, and understand how each column is computed."
Using Ask Oracle
Whilst trying out the feature I gathered the following tips and considerations:
This feature is only available when using HTML view of the reports
Admins must enable Generative AI in the application’s settings (available for enterprise EPM environments only)
The agent analyses the data available in the current report grid and point-of-view context. It does not automatically analyse data that is not displayed in the current grid view. For example, I couldn’t ask it to compare against a different Period POV selection unless that period was displayed in the grid. That would be a useful enhancement for the future.
Users can use the Copy & Edit button on a previous question to copy and edit the question quickly in the chat text box. I’d like it if Oracle adds a copy icon for the agents’ responses too!

A tip for Administrators: check the Grids in your reports have a meaningful name – rather than ‘Grid 1’! Users will soon see the Grid Names appear so it would be good to tidy up ahead of the release to Production environments. Even hidden grids will appear here for users.

Final Note
It’s an exciting new feature and it will be good to see how this grows.
One development I’d really like to see is the ability to analyse the report data and then work with the agent to create or fine-tune the commentary on the report which is then finalised and signed off by the user and saved to the management report pack.

Comments